Numeracy and Historical Thinking - Timeline with attitude
With much of the professional development focus on numeracy in Ontario this year, I've been contemplating the connections between numeracy and historical thinking.
There are the obvious statistics and graphs that we all use to unpack historical content, such as this graph from Canadian Sources Investigated:
 |
| The enlistments (green) and the casualties (purple) for the months of 1917 is a great example of how we often think of "numeracy." Students need to interpret and understand the "content" and implications of it. This is great! |
While these types of activities are a necessary and excellent part of understanding the events of the past, alone, they are not yet really historical thinking. What I've really been wondering is how do numeracy skills and concepts overlap or converge with the historical thinking concepts?
Earlier this year, one of my more numerate colleagues shared some of her realizations from a lesson study observation, where she was asking her grade 9 math students to create graphs, and observed that her students "weren't even spacing out the ticks on the graphs. .. they should've learned that in grade 5!" It immediately struck a chord with me. That is exactly the same frustration I had had with my grade 10 history students when I asked them to make timelines! I hadn't even thought of timelines as a "math thing!" Something I had been thinking of as a "history thing" was really a numeracy skill that many of my students were not yet able to apply in various contexts. My learning: timelines require a lot of numeracy to be read, understood, and/or constructed.
The purpose of a timeline is to see when events happened in relation to each other. This is proportional reasoning. .. a concept that has been the focus of much professional development in our district for math teachers over the last few years. If we, in our humble history classrooms, can help students to construct better timelines in history, we will be supporting both numeracy and historical thinking.
When we start asking students to create Timelines with Attitude, the connections become even more obvious and complex.
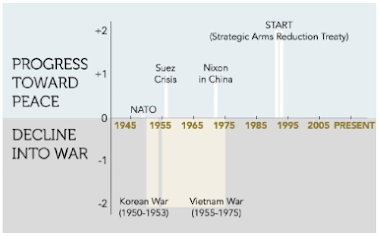
Essentially, a Timeline with Attitude (or Living Graph, or "Time-itude") asks students to rank events, people, and developments on a scale in relation to a "progress" or "decline" type question. This scale is shown on a y-axis, where time is the x-axis. (See, I told you the numeracy would be more obvious!)
When students construct a Timeline with Attitude, they can demonstrate a powerful understanding of the historical thinking concept: Continuity and Change. .. especially if they can identify turning points and analyze trends over time.
In this video from The Critical Thinking Consortium, students are introduced to the concept of Continuity and Change through the example of the experience of Chinese Canadians through the 20th century. There's a great use of a graph that shows immigration levels that dramatically illustrates the concept.
There are so many ways to use Timelines with Attitude. I've used them as introduction activities, process learning, unit culminating, and even as the centerpiece of a final evaluation and interview/defense.
This is an example of my students' work from later in the year in the 1945-1982 unit.

Students worked with a partner to research and produce a timeline with attitude on a particular theme of the time. They had to decide what would be on the y-axis and share it with their peers.
In this case, the "Timeitude" was a process piece before writing their reflection on the time period (1945-1982) as a whole.
In the Ontario math processes, students are representing their understanding. I think this may be roughly analogous to interpret and analyze in the Canadian and World Studies curriculum inquiry process. But I think there are likely many more connections to be made.


Comments
Post a Comment